https://steadiness-193.tistory.com/149
Matplotlib - plt : 선그래프, xlabel, ylabel, title, legend(범례)
데이터 불러오기 서울에서 경기도로 이동한 인구 데이터 값 import matplotlib.pyplot as plt 한글 폰트 문제 해결 from matplotlib import font_manager, rc font_path = 'c:/Windows/Fonts/malgun.ttf' font_na..
steadiness-193.tistory.com
위 포스팅에서 선그래프를 그릴 때
3가지 방법으로 실행하는 것을 살펴봤다.
지금은 좀 더 자세히 어떻게 다르게 이용할 수 있을지 알아보자
시리즈 제작

위와 같은 시리즈를 선그래프로 그려보자
1. 시리즈.plot()

이상 없이 잘 나왔다.
시리즈.plot의 장점은 바로 figsize를 조정할 수 있는 것이다.

그래프를 꾸미려면 color나 marker를 인자로 넣으면 된다.
또한 x축 label 등은 plt.xlabel을 이용해주면 된다.

2. plt.plot(시리즈)

이 또한 문제 없이 잘 그려졌다.
다만 plt.plot으로는 figsize를 조정할 수 없다.

figsize를 조정하려면
plt.figure(figsize=(n, n))을 이용해야 한다.
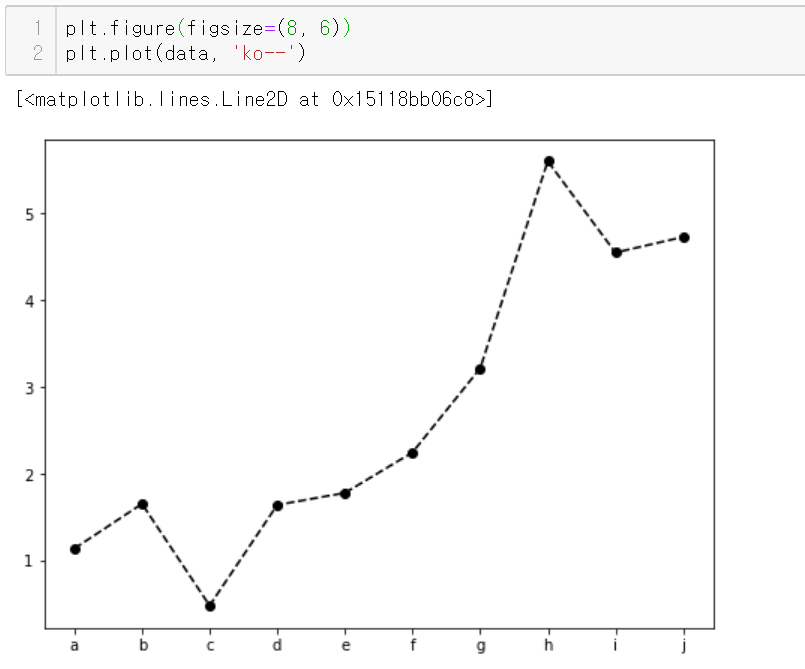
추가적으로 시리즈.plot()과는 조금 다르게
색, 마커모양, 선 스타일을 바로 설정해줄 수 있다.
정리
| 기준 | 시리즈.plot() | plt.plot(시리즈) |
| figsize | 시리즈.plot(figsize=())로 조정 가능 | plt.figure(figsize=())로 조정 |
| plot 꾸미기 | marker, color 등을 직접 명시해서 조정 | '색마커모양선스타일' 바로 조정 가능 |
아래 포스팅과 함께 내용 추가 및 정리
https://steadiness-193.tistory.com/169
Matplotlib - axe 객체 생성해서 그리기
https://steadiness-193.tistory.com/168 Matplotlib - plot 차이 : 시리즈.plot vs plt.plot(시리즈) https://steadiness-193.tistory.com/149 Matplotlib - plt : 선그래프, xlabel, ylabel, title, legend(범례..
steadiness-193.tistory.com
'시각화 > Matplotlib' 카테고리의 다른 글
| Matplotlib - plt.subplots (0) | 2020.07.23 |
|---|---|
| Matplotlib - axe 객체 생성해서 그리기 (0) | 2020.07.23 |
| Matplotlib - 하나의 axe 객체에 여러 개 그래프 그리기 (0) | 2020.07.22 |
| Matplotlib - 그래프를 파일로 저장하기 : savefig (0) | 2020.07.22 |
| Matplotlib - add_subplot : set_xticks, set_xticklabels, tick_params (0) | 2020.07.22 |


