반응형
https://steadiness-193.tistory.com/166
Matplotlib - 하나의 axe 객체에 여러 개 그래프 그리기
[1개의 컬럼 이용] (예시 : 히스토그램) 1. add_subplot add_subplot을 이용해 ax 틀을 생성한다. 이제 ax에 바로 그래프 종류를 기입해서 그려내면 된다. ax.hist 박스로 체크한 부분에 보이듯이 plt.xlabel을..
steadiness-193.tistory.com
위 포스팅과 맥을 같이한다.
[1개의 컬럼 이용]
(예시 : 히스토그램)
1. add_subplot
| fig = plt.figure(figsize=(N, N))
ax = fig.add_subplot(1, 1, 1) |
| [1] ax = sns.distplot ax = sns.distplot |
| [2] sns.distplot sns.distplot |
1, 2 두가지 경우 모두 가능하다.
[1]

[2]

2. subplots
| fig, ax = plt.subplots(1, 1, figsize=(15, 5)) fig, ax = plt.subplots(figsize=(15, 5)) |
| [1] ax = sns.distplot ax = sns.distplot |
| [2] sns.distplot sns.distplot |
subplots도 위 1, 2번 두가지 경우 가능하다.
[1]

[2]

[2개의 컬럼 이용]
(예시 : scatter)
2개의 컬럼도 1개의 컬럼처럼 모든 경우에 똑같이 잘 그려진다.


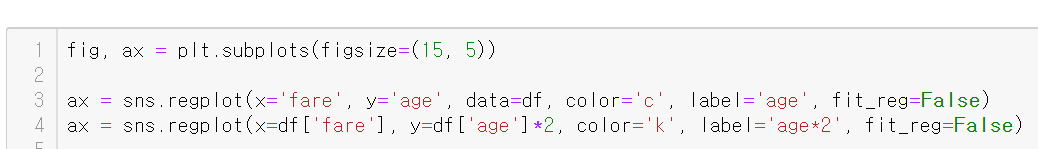


박스 체크한 것 처럼
plt.xlabel이든 ax.set_ylabel이든 사용할 수 있다.
[실용적 사례]


반응형
'시각화 > Seaborn' 카테고리의 다른 글
| Seaborn - 이차원 밀집도 : kdeplot (0) | 2020.07.31 |
|---|---|
| Seaborn - 바이올린 플롯(바이올린 그래프) : violinplot (0) | 2020.07.30 |
| Seaborn - 박스 플롯(박스 그래프) : boxplot (0) | 2020.07.29 |
| Seaborn - 빈도 그래프 : countplot (0) | 2020.07.29 |
| Seaborn - 그래프 그릴 때 헷갈리는 부분 정리 (0) | 2020.07.28 |


